Search
Financial Reports
You can get an overview over all created invoices during a certain time frame by using the Financial Reports option in Lodgit Desk. As long as the invoice date lies within the selected time frame, the invoice will be shown.
1. To view a financial report, go to Administration and then Financial Reports. A new window showing the Listwill open.
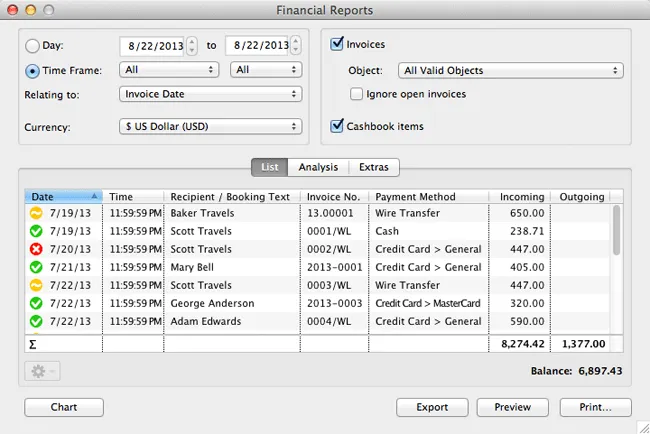
2. You have two options to select the time frame for the financial reports:
- the free choice using two calendar sheets that allow you to select a date for the starting and a date for the ending point and
- the selection of a time frame using a drop-down-menu that allows you to easily pick certain months, quarters, six-month-periods or years.
3. On the right side, please select whether you want to analyse invoices and/or cashbook entries. There you can also choose to exclude unpaid invoices from the analysis by selecting the option “ignore unpaid invoices”.
4. You can also limit the analysis to a certain object or rentable unit of yours by selecting it in the drop-down-menu.
The invoices are labelled with a certain symbol, depending on whether it is a paid ![]() , an unpaid
, an unpaid ![]() or a cancelled
or a cancelled ![]() invoice.
invoice.
Note: In order for the balance to be correct, cancelled invoices will appear under Incoming (payments) as well as under Outgoing (payments).
Charts for the Financial Reports
Lodgit Desk can generate charts of your financial reports for you to print out. You can access those by clicking on the Chart button.
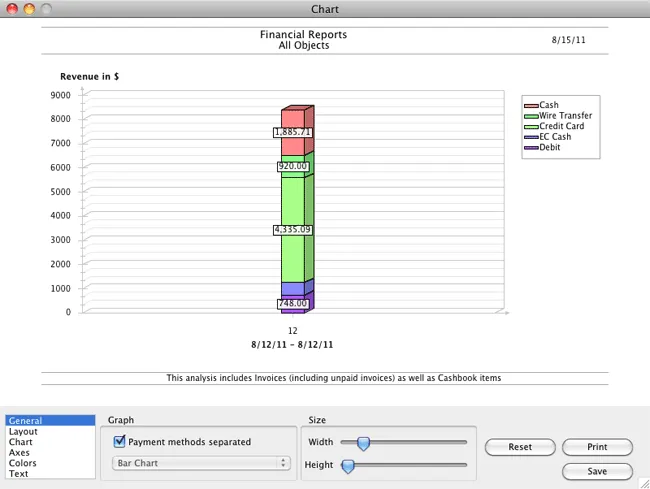
The charts offer several options so that you can customise them:
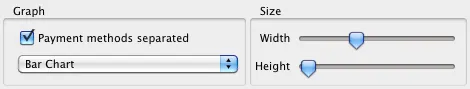
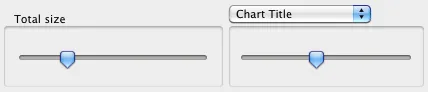
General lets you decide how large your graph is going to be. You can also choose if you want to show payment methods separately and what kind of graph you want to use. For the financial reports, you can choose between a bar and a line graph.
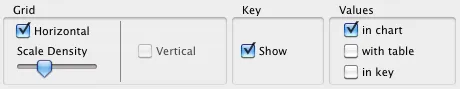
Layout lets you decide whether you want to see the grid in the graph, whether you will show a key and where you want the key to be.
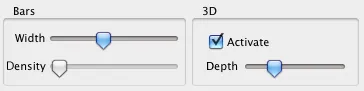
Settings concerning the graph itself can be found under Chart. For a bar chart, you can decide how wide the bars will be as well as whether you want to add a 3D effect to them. For a line chart, you can decide how thick the lines will be.
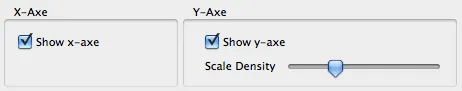
Axes will let you decide, whether you want to show the x- and the y-axe, as well as how dense you want the scaling of the y-axe to be.
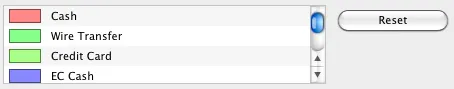
You can define colours for bars and lines under Colours.
Under Text you can define the font sizes within the chart.
Tip:
You can reset all settings back to the standard by pressing the Reset button.
Analysis
Under Analysis you can evaluate all billed items (invoices and/or cashbook entries) within a certain time frame. This analysis can be done for “everything”, payment methods, tax rates or type of income (lodging, extras, deposits).
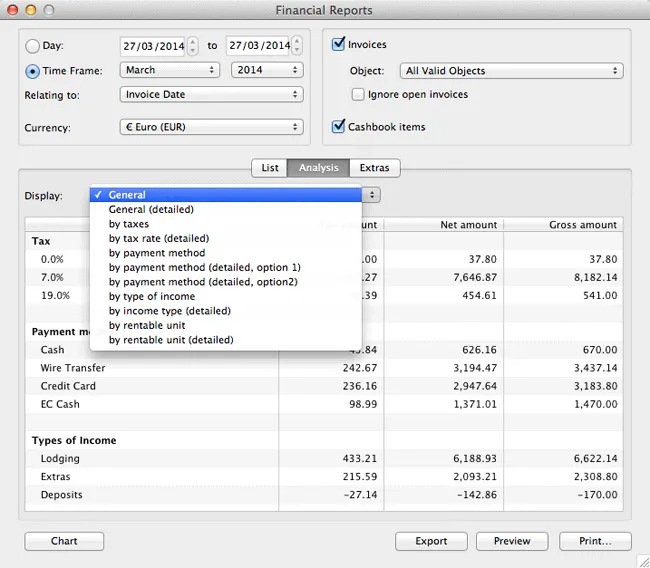
You can either have the analysis done for the total of the selected time frame or, more detailed, by day, month or year:
If the time frame covers up to 31 days, the detailed analysis will be done by day. If the time frame covers between 32 days and 12 months, the detailed analysis will be done by month. If the time frame covers more than 12 months, the detailed analysis will be done by year.
Revenue from units that were later moved to a different object will be split accordingly: Revenue generated until the move, will be listed with the old object. The rentable unit will be highlighted. Revenue generated after the move will be listed normally under the new, current object.
Charts for the analysis
Once again, you can generate a chart for this analysis, however the display option “General” cannot be used.
Select a display option (by taxes, by payment method, by type of income) and then generate the chart by clicking on the Chart button.
Here’s an example for the display option “by taxes”:
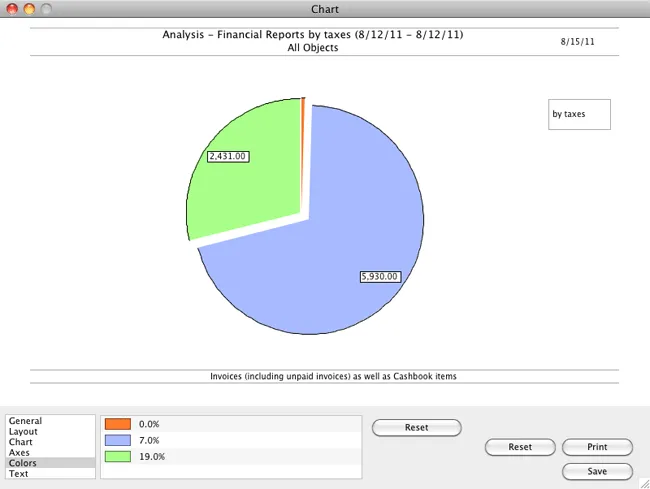
For this financial report, you can only select the pie chart.
Which extra created the biggest revenue?
You can also evaluate all the billed extras by clicking on Extras.
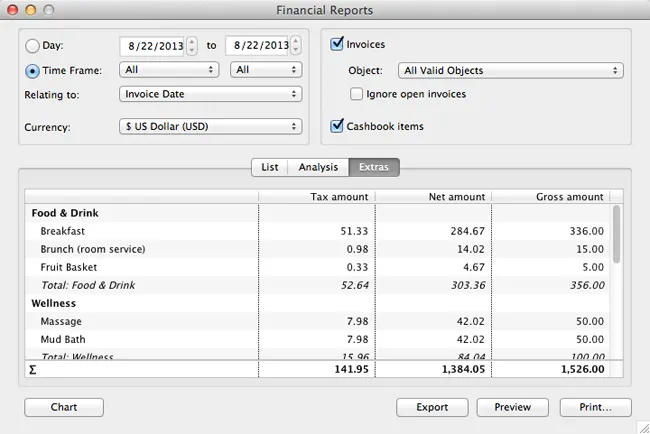
The extras will be structured the same way that you have structured them in the Extras Management. If you want to have more, less or different categories, you will have to add or delete them in Extras Management.
Charts for the extras
You can generate a chart for the extras as well.
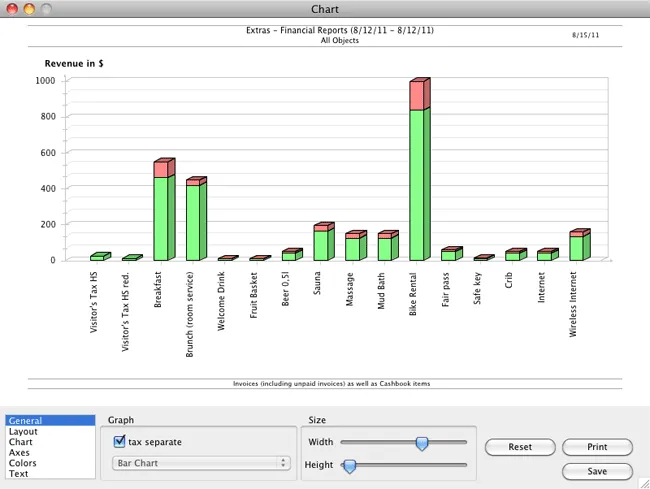
The charts offer several options so that you can customise them:
For this report you can decide whether you want to show the tax amount separate. If you want it separate, you can choose between a bar and pie chart; if you choose to show it separately, you can only select the pie chart.