Search
-
General information about Lodgit Desk
-
Description of the menu items
-
Reservation Schedule
-
Edit preferences
- Edit the Preferences
- Edit functions of the reservation schedule
- Edit booking defaults for the reservation schedule
- Evaluate labels
- Create and manage labels
- Preferences for tax rates
- QuickCorrect: edit tax rates in existing bookings
- City / Accommodation Tax
- Preferences for payment terms and methods
- Preferences for currency
- Numbering for invoices, offers and confirmations
- Guest Preferences
- Emails
- Print and PDF Options
- Preferences for letter layout
- Settings for the sender address
- Preferences for country address formats
- Return Confirmation
- Deposit Options
- Invoicing options
- Create database backup
- Check for updates
- Settings for Proxy Server
- Preferences for accounting export
- Show EPC QR code on invoices
-
Object Management
-
- Create and delete rentable units
- Edit rentable unit information
- Edit unit's profile
- Define Features for a Rentable Unit
- Automatically change the cleaning status of a rentable unit
- Add short description for a rentable unit
- Link package to a rentable unit
- Optional: packages bookable online
- Define print options
- Statistics options
- Notes
- City/Accommodation tax for a rentable unit
-
Extras and packages
-
Create and manage price lists
-
Bookings
- Bookings
- Create booking
- Create a (group) reservation using the booking assistant
- Open booking
- Change booking status to Booked
- Change booking status to Checked In
- Change the booking status to Checked Out
- Change booking status to Disabled
- Edit booking time frame
- Move booking to another unit
- Split a booking (move into another unit)
- Add a main contact to a booking
- Edit price and price unit for a booking
- Add an agent to a booking
- Add child discount
- Add, edit and bill deposits for bookings
- Add guests to a booking
- Print registration form
- Add extras and packages to a booking
- Deleting extras from a booking
- Add notes to a booking
- View and print correspondence
- Add, edit and delete a city tax
- Create group reservation
- Remove from group reservation
- Overview over the (group) booking
- Edit the main contact of a booking
- Delete booking
-
Guest Management
- Guest Management
- Add / Duplicate / Delete Guest
- Merge guests
- Block guest
- Automatic and custom groups
- Search for a guest
- Send emails
- Write (bulk) letters and emails
- Edit guest profile
- Define guest discount
- Add and edit communicative and other data
- Add and edit notes to a guest
- Import guest data
- Export guest data
-
User Management
-
Correspondence
-
Dunning Run
-
List of unpaid invoices
-
Text Management
-
Create receipts & Cashbook
-
Financial Reports
-
Agents
-
Lists
-
Additional Modules
-
- Additional Module: Synchronisation and Channel Manager
- General settings for the synchronisation
- Settings for the Lodgit Online Booking System
- Settings for synchronising with channel manager CultSwitch
- Settings for synchronising with channel manager DIRS21 channelswitch
- Settings for synchronising with channel manager HotelSpider
- Settings for synchronising with channel manager MappingMaster
- Settings for channel manager Siteminder
- Frequently Asked Questions Regarding Channel Managers
-
-
- Kassensicherungsverordnung 2020 (TSE) in English
- Putting the TSE into operation
- Initialisation of the TSE and activation of the interface
- Working with the TSE
- Status Messages of the TSE
- Overview of functions in expert mode
- TSE Export
-
- FAQs about Cash Security Regulation & TSE
- Moving the TSE to a new computer
- The certificate of my TSE has expired - What to do?
- Performing firmware updates for the Epson TSE receipt printer TM-m30F
- Connection to local IP address not possible
- Returning to the TSE wizard if you closed the message at the beginning
- Unlock and change PINs and PUK
- Status message: "Not authorised"
-
-
-
Definitions
-
Frequently Asked Questions
- Frequently Asked Questions
- Installing the 64-bit version under Windows
- Moving your Database to a new Server
- Transfer Lodgit database to a new computer
- Download Server Database Backup
- Postpone, shorten, extend billed bookings
- Enter the opening balance of the cash register in the Lodgit cash book
- Channelmanager DIRS21: Set Up Inheritance
- Database server and license data update
- Price for final cleaning to be added to the first night's stay
- Change payment method of invoices
- Renew Your License
- Completing of the HESTA form (CH)
- Which POS systems are compatible with the Lodgit interface?
- MappingMaster - Transfer of prices and linking of extra items
- Datenbankserver: Database malformed
- Database server and "vanished" online bookings or "changing" vacancies
- How to connect Lodgit and Airbnb
- How do I delete an online booking?
- Highlight blocked dates in the Lodgit Online system booking calendar
- GoBD-export - How do you access the data during a tax audit?
- Seperate Invoices for one Booking
- Display Options for the Occupancy Plan
- Completing and setting the cash book to 0
- macOS High Sierra: Do not store database in the iCloud
- Database server error: Database is locked
- Transmitting prices and linking extra items to MappingMaster
- Use Lodgit Desk on more than one computer
- Assign Booking
- How to charge cancellation fees
- Sell and redeem vouchers in Lodgit Desk
- Create comments and remarks on invoice items
- Highlighting Special Periods in the Occupancy Plan
- Invoice with Company Address but Registration Form with Guest Address
- Email attachments will be sent to the recipient as 'winmail.dat'
- Change Language of Lodgit Desk
- cubeSQL: Disconnected / switch back to local database
-
Shortcuts
Extras List for visitor’s tax, food & drink etc.
The extras list helps you analyse the revenue and the expected future revenue by creating a list with the calculations for a certain time frame that you can then print. If a booking’s revenue is being taken into account depends on whether or not the booking lies within the time frame you have specified.
The analysis does not make a difference between bookings that have already been billed and bookings that have not. All extras are analysed for every single day. You have the option to filter the analysis for certain booking status.
You can use this list for your kitchen staff to know how many breakfasts and dinners are booked for one day or to find out how much visitor’s tax you collected last month.
You can also use this list to easily compare the extras revenue of a month to the previous year or the current quarter to the last one.
1. Go to Lists > Extras List which will open the window for the extras.
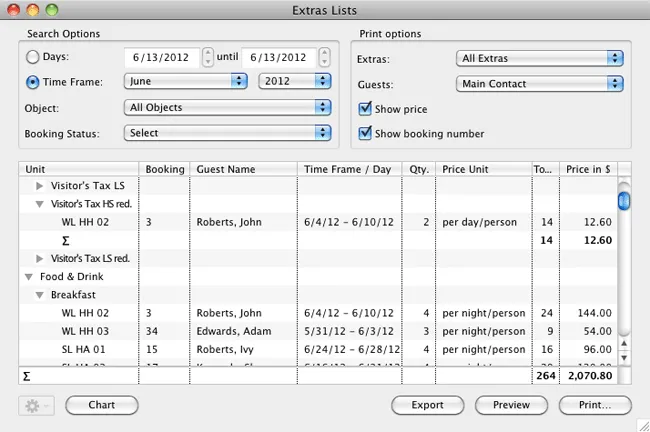
2. Select the time frame for which you want to do the analysis. You have two options on how to do that:
- The free time frame, that you can define over the starting and ending date using the two calendars and
- the limited time frame that you can define using the drop down menu and selecting a month, quarter, six-month-period or year.
3. In the drop down menu on the right side you can select the Extra that you want to analyse. If you didn’t select one, all extras will be analysed.
Note:
If you have organised your extras into groups in the Extras Management, you now select these groups and analyse them!
4. You can also restrict the analysis to only one object by selecting it in the crop down menu.
5. You can also restrict the analysis to certain booking status by selecting them in the drop down menu.
6. You can print this list by pressing the Print button. You can also Export the list as an Excel file and then save it on your computer. That file can then be edited by software such as Microsoft Excel 2007 and newer (Windows), iWorks Numbers (Macintosh) or OpenOffice (Windows, Macintosh).
Charts for extras
You can generate a chart for this analysis by clicking on the button Chart.